Building a global CO₂ map, starting in Europe
A curated, source-traced view of the European CCS value chain: point emitters, hubs, terminals, storage sites and CCS/CCUS projects. Filter, follow the chain end to end, and find the picture that matters to your work.
A standalone data product, separate from our advisory.
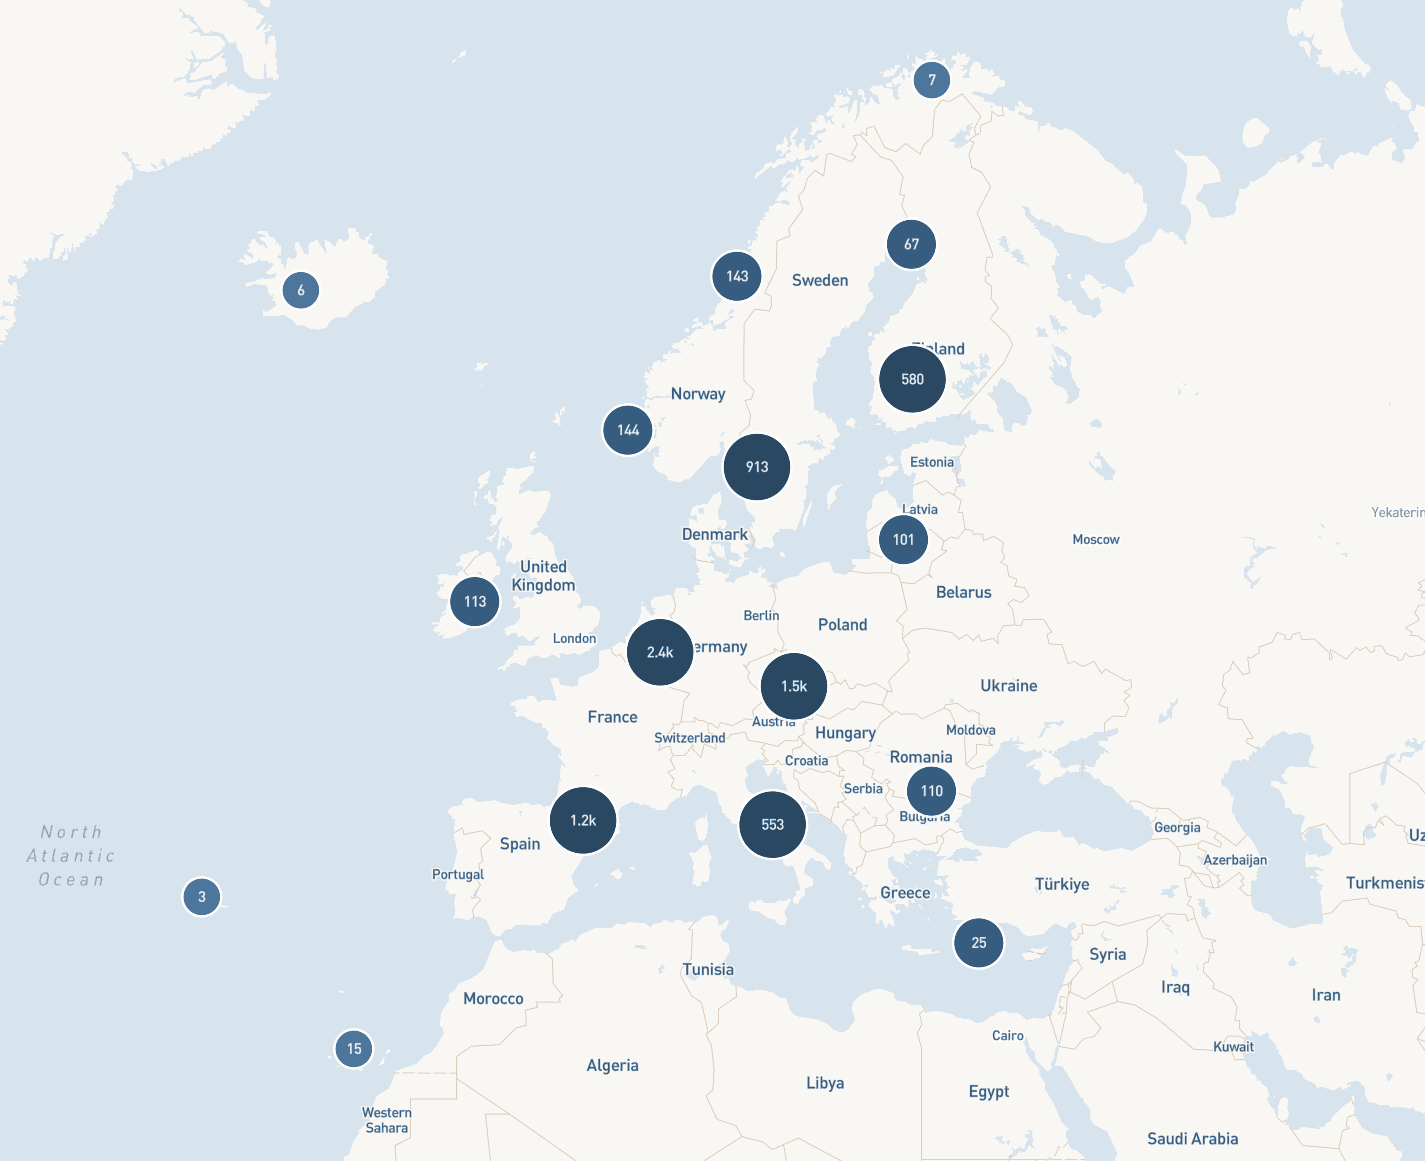
An Explorer for the full CO₂ value chain
The Explorer lets you move from a single facility to a whole region, and from a single emitter to the storage site that could receive its CO₂. Designed for fast lookup, comparison and screening.
Explorer map
All five layers on one map: verified point emitters, hubs, terminals, storage sites and CCS/CCUS projects, with the connections between them. Pan, zoom and select to drill in.
Per-node insight
Open any node on the map (emitter, hub, terminal, storage or project) for verified attributes: operator, status, capacity, counterparties and emissions where public.
Follow the chain
Move from an emitter to the hub that aggregates it, to the terminal that loads it, to the storage site that receives the CO₂. The whole chain, connected.
Filter and compare
Filter by country, sector, operator, layer type, project status and storage type. Compare regions and layers side by side.
Every layer of the chain, in one place
The CO₂ chain is not just a list of emitters. It is emitters, hubs, terminals, storage and projects working together. Each layer is mapped, attributed and joined to the others.
Emitters
7,500+ active point emitters across the European CCS value chain, with sector, operator and parent company linkage, including 2,800+ above 25,000 t CO₂/year.
Hubs
Aggregation points where streams from multiple emitters meet before onward transport or shipment.
Terminals
Loading and offloading interfaces between transport modes: ship, pipeline, truck and rail.
Storage sites
Geological reservoirs with operator, formation type and project association where public.
Projects
CCS and CCUS projects from early concept to operating, with status, timeline and counterparties.
Pan-European, with depth around the Nordic and North Sea belt
The map covers Europe at large, with focused depth where the first CCS value chains are taking shape: Norway, the UK and the Netherlands, plus the wider Nordic and North Sea region.
Clear inclusion criteria, so you know what you’re looking at
The map covers the full CO₂ value chain across Europe, with focused depth around the Nordic and North Sea belt where the first chains are taking shape. Each layer has a defined inclusion rule.
Geographic scope: Europe (31 countries), with the most depth in Norway, the UK, the Netherlands and the wider North Sea region. Coverage of the full CO₂ value chain, end to end.
- EmitterAn active point source of CO₂ with a known location, sector and operator, traced to a public emissions registry.
- HubAn aggregation point where CO₂ streams from multiple emitters meet before onward transport or shipment.
- TerminalA loading or offloading interface between transport modes: ship, pipeline, truck or rail.
- StorageA geological reservoir intended to receive and permanently store CO₂, with operator and formation type where public.
- ProjectA named CCS or CCUS initiative from early concept to operating, with status, timeline and counterparties where public.
Three ways teams use the map
Common patterns from teams using the map to screen projects, assess regions and design CO₂ flows. The same data, different questions.
Screen candidate point emitters around a planned hub or storage site by sector, volume and operator. Use the value-chain layers to see existing infrastructure nearby, and what is already announced in the region.
Cross-check announced CCS and CCUS projects against the emitters, hubs and storage sites in a region. Identify operators, counterparties and clusters tied to an investment case, with every record source-traced.
Map emitter clusters, terminals and storage sites to scope routes, fleet and aggregation logic. Follow the chain from source to receiving site, with verified emissions and sector context for each node.
Public authoritative data, brought together
The underlying data is public. The value is in the assembly: consistent IDs across registries, geocoding, operator and cluster linkage, full value-chain joining, filtering and curated presentation.
Every record is source-traced. We do not resell registry data: we curate, link and present it.
- EmissionsEU ETS / EUTL, UK ETS and national emissions registries
- Energy and project dataIEA, IOGP and Global CCS Institute
- OperatorsCross-referenced operators, clusters and ownership structures
- GeographyFacilities geocoded and joined to hubs, terminals and storage sites
Sign in, preview, go deeper when ready
Create an account on the Map site, explore the map at cluster level, and subscribe to unlock the data when it makes sense for your team. Plans and pricing are shown on the Map site.
Open the Map
Go to map.frontcarbon.com and create an account.
Explore the map
See aggregate emitter clusters and preview the example facility.
Unlock when ready
Subscribe to a plan on the Map site. Plans and pricing shown there.
Start free, unlock when you’re ready
Explore the map for free. Subscribe to unlock verified detail and the full European CO₂ value chain. Change or cancel anytime.
Explore the map
No card required.
- Explore the map: aggregate emitter clusters
- Preview the example facility
- Verified detail and the five layers stay locked
Every emitter in Europe
or €190 / year — two months free.
- Every CO₂ emitter in Europe, full detail
- Verified figures, ETS exposure, sector benchmarking
- Map, list and analysis for emitters
The complete value chain
or €290 / year — two months free.
- Everything in Europe – Emitter
- All four infrastructure layers: storage, hubs, terminals, projects
- Cross-filter and distributions across all five layers
Larger team or a custom scope? Contact us for enterprise at post@frontcarbon.com.
Open the map, follow the chain
The fastest way to understand the European CO₂ chain is to open the Explorer and look. Preview your region. Go deeper when you need depth.